View Analytics
OpsCenter provides extensive analytics, including:
- Warehouse utilization and efficiency studies, including utilization heatmaps
- Trending data on total cost and warehouse utilization over time
- Distributions of warehouse session uptimes and sleep times to give efficiency and autosuspend insights.
- Robust filtering and drilldown capabilities by a number of useful dimensions
Behind the scenes, OpsCenter performs per-query cost attribution, enabling deep drill down into exactly what’s driving query quantity and cost, by a number of dimensions.
Let’s quickly step through some of the available reporting.
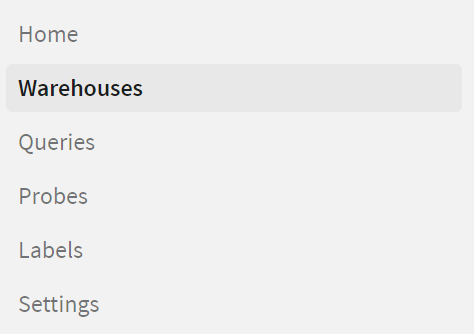
Click on the “Warehouses” link in the left-hand navigation menu:
This will bring up the main Warehouse Utilization report:

This report shows a view of combined activity for all warehouses, indicating daily total cost as well as estimated utilization (percentage of the time the warehouse was used to full capacity).
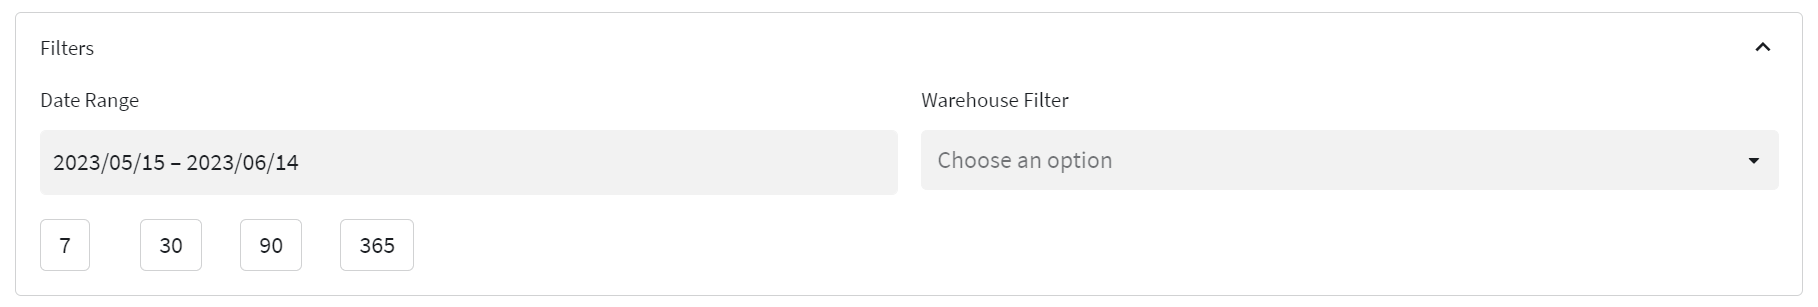
The time period covered by the chart, as well as the resolution (days, weeks, months) of each bar can be adjusted by using the date filter controls at the top of the page. In addition, the warehouses included in the chart data can be filtered as well:
Below the cost and utilization chart are two additional analyses of warehouse activity:
- Duration of Warehouse Session: This shows a distribution of the number of Warehouse Sessions by duration. A Warehouse Session is defined as the time between when a warehouse is started and stopped.
- Time before Warehouse Start: This shows a distribution of the number of warehouse sessions, by how long a particular warehouse was stopped before it was started.
The combination of these metrics can be quite useful for understanding the ratio of quiesced to active time for all warehouses (or particular warehouses as selected in the Filters), and can help inform correct warehouse sizing and auto-suspend settings.
In addition, an alternate Heatmap view of warehouse utilization is available, and can be accessed by selecting “Warehouse Heatmap” from the “Select Report” dropdown at the top of the page:
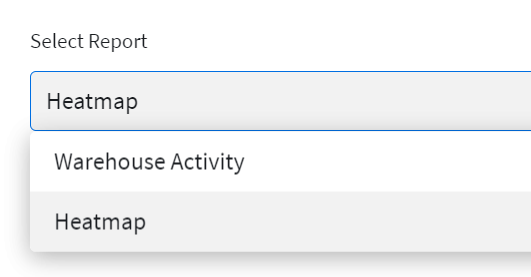
The Heatmap view shows warehouse utilization over time, broken out by day of the week. Darker shading indicates heavier warehouse utilization, and lighter indicates a higher fraction of idle time. This information can give immediate insight into whether your warehouses are sized appropriately, and may indicate where sizing needs to be adjusted throughout the week for maximum cost efficiency.

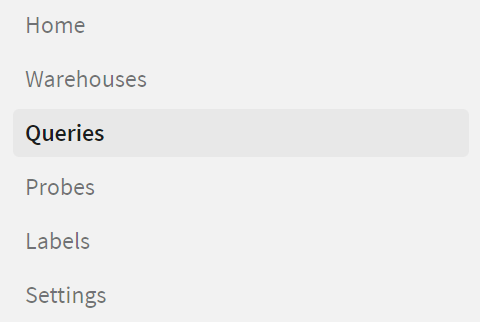
Next, let’s look at the query analysis reports. Click on the “Queries” link in the left-hand navigation menu:
This will load the Query Activity Report by default, as well as a set of available filters for date range, warehouse, and OpsCenter labels (more on these later). Note that any filter criteria set at the top of the page will apply to other report types available on this Query Activity page. Filters can be accessed by clicking on the “Filters” dropdown:
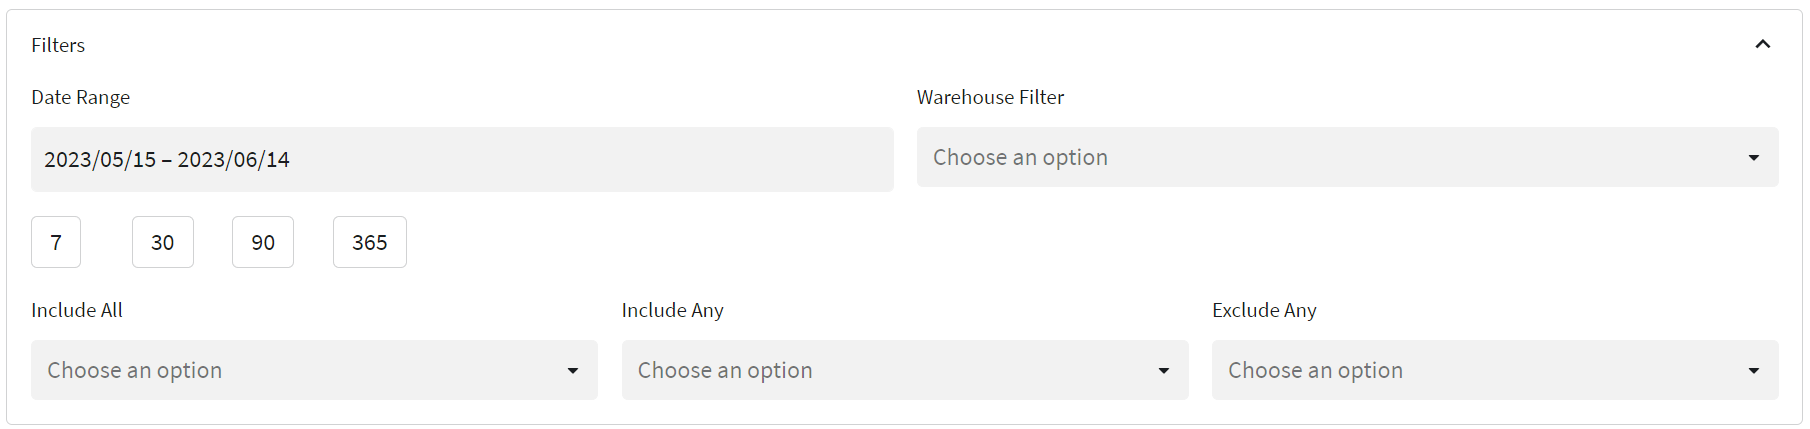
We’ll cover advanced aspects of filtering (“Include All”, “Include Any”, “Exclude Any”) in a later section.
Let’s quickly step through each of the available reports.
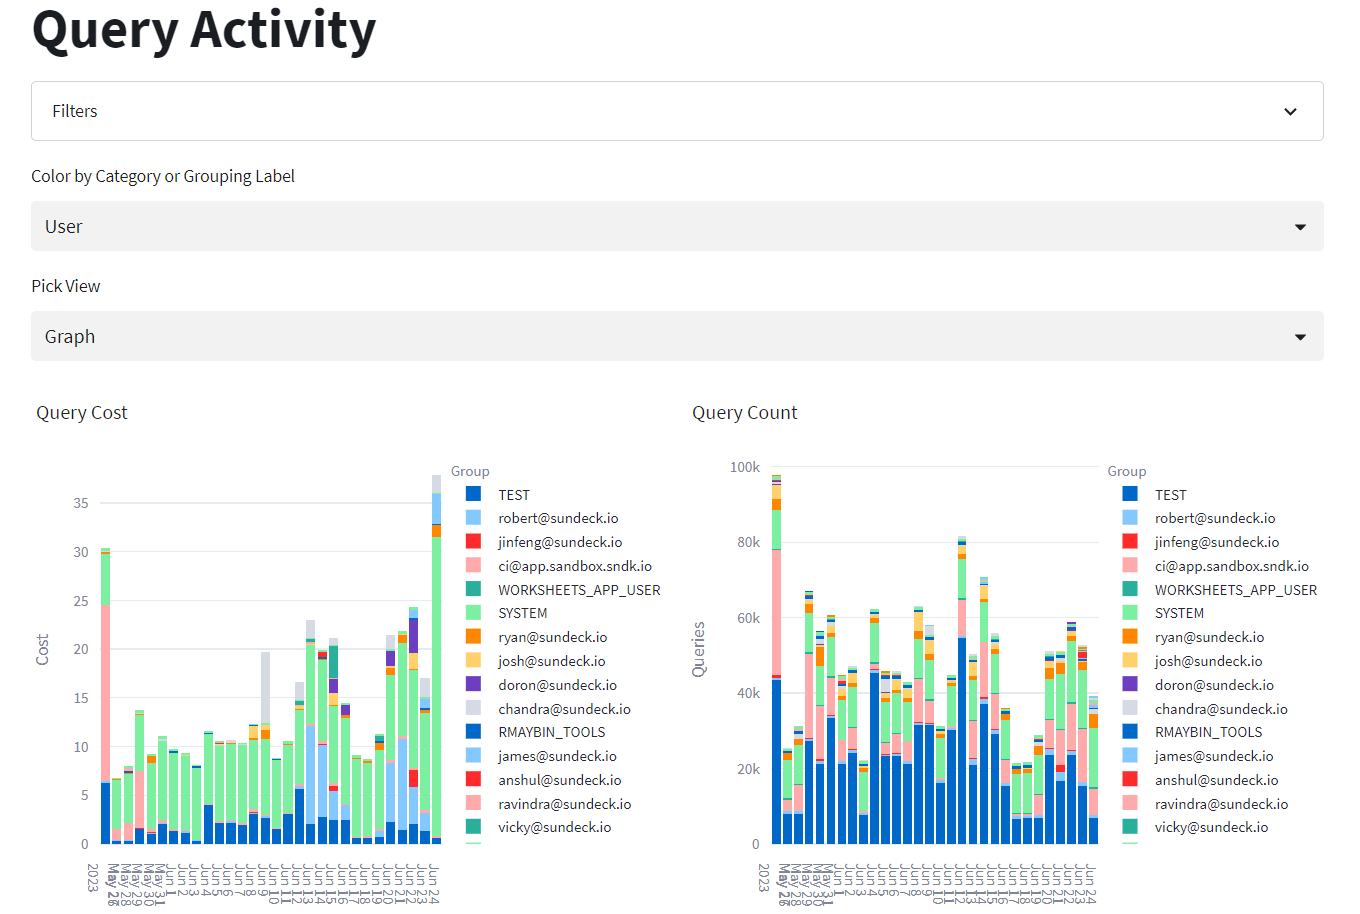
This report provides views of query cost (left graph) and query counts (right graph), along a selected dimension (User, Warehouse, Role, Query Type, and Execution Status). Each value of the selected dimension is displayed as a different color in the stacked bar chart, and can be included or excluded from the chart by clicking on its value in the legend.
This report can be accessed by selecting it from the “Select Report” dropdown at the top of the page:
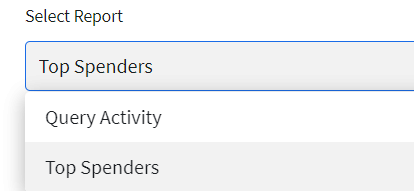
This will load the Top Spenders report:
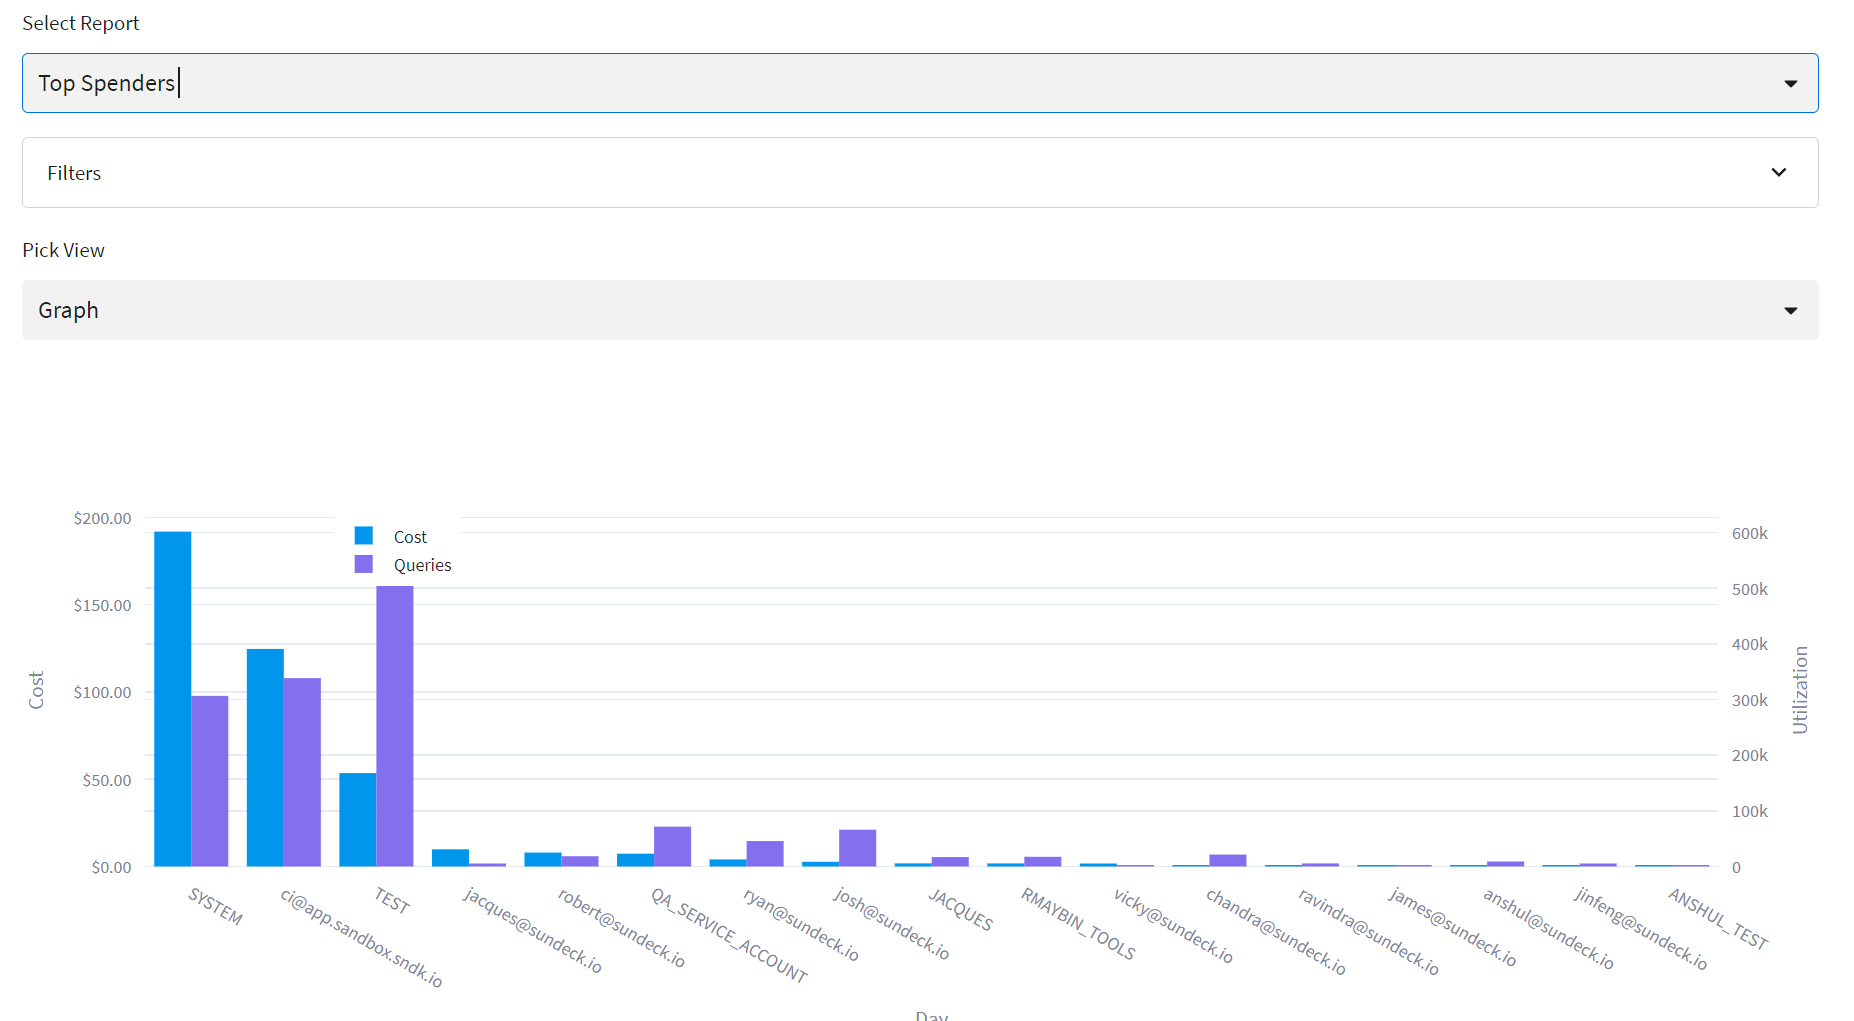
Here we can see the top users by total query cost, as well as the total number of queries for each of these users. Query cost is an estimate (based on query runtime, warehouse size used by the query, and an estimation of resource utilization based on concurrency), and is intended for relative comparison purposes only.